Architect of People Experience, Advocate, and Strategist.


Scaling Assets for Reach
Building content engagement & reach via user personas and analyzing user data to deliver delightful, relevant, and useful resources to over 75k+ educators on a personalized learning platform.

My Role: Web & Data Analyst, UX Researcher & Designer, Product Manager
Client(s): New York City Department of Education: WeTeachNYC
Collaborator(s): UI/UX Designer, Data Analysts, Product Manager
Timeline: October 2016 - July 2018
Overview
WeTeachNYC was a team within the NYC Department of Education with a website of the same name. The website acted as a repository housing relevant learning and curriculum content for NYC's 75k+ educators.
The research I conducted was twofold: based on user and client perspectives. For users, I sought to understand For clients, I researched user habits and analyzed user data (via web analytics & feedback via help desk) to provide insight & recommendations to content developers.
Users' perspective:
-
How can I find content & resources that I need quickly and easily?
-
How do I know this is a good resource?
-
How can I save this resource to easily find it later?
-
How can I share this resource?
-
How can I talk to others who have used this resource?
Client's perspective:
-
What topics or kinds of resources should we create that educators (users) will find useful?
-
How can we anticipate the needs of users and provide them the content they seek quickly and easily?
-
How do we know if users find these resources useful?
My role was to help clients understand their users' needs by analyzing and synthesizing the data and using causal-comparative research to glean insights. I also collaborated with the product manager, fellow UX/UI designers, and data analysts to conduct focus groups of users to understand user experiences and test new features. As the product manager for the backend/data portion of the website, I worked cross-functionally with clients (~25 teams) to train them on the submission process for content and advise them on content creation. This case study covers various portions of the work conducted.

.png)
Discovery & Understand
Causal-comparative Research | Focus Groups | Interviews | Journey Mapping | User Personas | Wireframes
As the lead and owner of the backend of WeTeachNYC, what we affectionately called the LOR (Library of Resources), I collaborated with 25+ teams to help them understand the users' perspectives in order to create content that was relevant.
Focus Groups & Interviews
-
I with another UX researcher conducted focus groups to observe users as they utilized the platform and walked us through their experience. Afterward, I conducted interviews (by creating questions) as a control to the follow-up questions based on varying users' responses. We conducted focus groups and interviews to gain insight into how users responded to the site and later to get users' feedback on two new features that we launched (personalization and communities).
User Personas
-
Based on the focus groups & interviews, I created user personas. These user personas were useful in helping clients understand the various users that visited the site and engaged with their content. It was a great snapshot to identify user motivations, needs, perspectives, and decision-making (choosing which content was deemed useful identified by behaviors such as: saving the item to a collection, sharing, and/or downloading). This allowed clients to tailor the types of resources to fit user needs.
Journey Map
-
A journey map was a great way to synthesize information from the focus groups and codify the user's experience with the platform. A huge discovery that we learned from focus groups and interviews was the varying times within the school year for an educator. With this information from interviews, we were able to ascertain peak timeframes when specific content would be most useful (this was also confirmed by analyzing usage data of specific content = causal-comparative research).
Wireframes
-
I created wireframes for several purposes:
-
Draft wireframes of flyers that were sent to users & clients to announce a new feature of the learning platform
-
Draft wireframes of new ways to deliver analytics and insights to clients regarding the performance of their resources (this was not shipped/implemented due to timing of delivery)
-
Draft wireframes of a content guide to aid clients in better understanding how to identify resources to meet users' needs
-
Due to sensitivity of nature & confidentiality examples from the user perspective cannot be shown.


Testing, Iteration, & Implementation
Data & Web Analytics
The above is a wireframe of a flyer that I created to be sent to users and content creators informing them of a new feature added to the platform. Click through to see its many iterations!
Through causal-comparative research, I was able to compare user personas and their journey maps to web analytics. This information allowed me to identify user habits, devise hypotheticals, test them, and then use the information to make recommendations to submitting teams. This also aided in creating a Content Packaging Guide.
The Content Packaging Guide was a composite of all learnings for clients (submitting content teams new & old) to have as a resource when creating content. This guide allowed them to understand user motivations and create their content in a way that allowed for maximum reach and utility.
Beyond focus groups and interviews, the website had a "help desk" / contact support page, which allowed them to report any errors, make suggestions, and request specific content or features. I then synthesized this data and update insights and recommendations based on subsequent comparisons back to the user personas & journey maps.
.png)
Insights & Reflections
User Insights
-
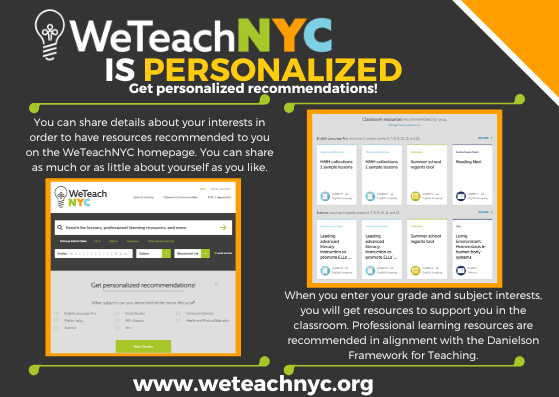
Relevant & Easily Accessible: Users loved when content that was relevant to a specific time period was featured on the homepage (content on back to school or others that aligned to the academic calendar). This made the content easily accessible and reduced the number of clicks or need to search for this content. Users also appreciated content that did not require them to log in to view and/or access. This information was validated through the user interviews and the causal-comparative research of web analytics.
-
Customizable & Editable: Users expressed a desire to have content in Word, PowerPoint, or another editable format. This allowed them the freedom to edit and customize the content for their classroom, adapting to meet the needs of their target audience.
Client Insights
-
Ways to Increase Engagement: Clients found the content packaging guide extremely helpful in understanding how to create content that users would find useful. The journey maps outlining particular times when clients would need specific types of resources were also useful.
-
Monthly & Annual Reports: Reports on how users engaged with their content, specifically top-performing content, was information that all teams wanted. It told them whether their content had an impact on users and it also allowed them to reflect on the content and improve those that didn't perform as well.


